Uranium stocks are running well behind the new paradigm in uranium prices, models looking at the sector show.
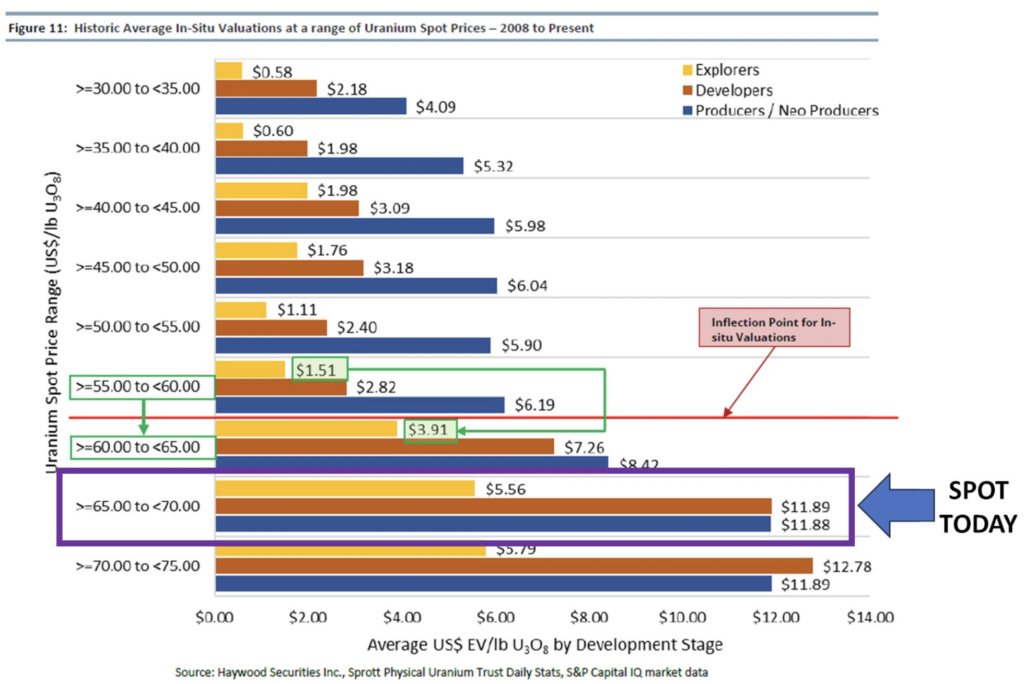
A chart from Haywood Securities Inc. shows just how far behind uranium mining equities are right now.
The price of spot uranium has moved some $15 upwards since August to the end of September, and while equities have responded – they have not moved anywhere near the highs seen 12-years ago.
While the price of uranium equities surged both around this time in 2021 and 2022, before dipping back, some uranium stocks are only now just hitting those highs.
We have yet to see mining companies’ stock prices reflect the reality of the market for the NetZero rocks and the new fair value, the models suggest.
According to Hawywood charts, equities in uranium explorers, near-term miners and current u-mining companies are nowhere near where the historic model for equities project.
In other words, equities are lagging behind spot.
The analysis suggests that with a spot in the US$65-$70 (a price we are now above), equities should be on average about $3.90 for explorers, $7.26 for developers and $11.88 for producers/near producers.

Long time uranium commentator on Twitter/X, Patrick Downes, shared the chart with followers.
“Investors always want to know what historic average EV/LB’s at different SPOT prices are,” he wrote.
“Well, thank you Haywood securities and here you go: Hint: No 99% of ASX U stocks are nowhere near historic valuations,” he said.
See chart below.


